Dashboard Overview
Your Clusters page is the starting point for managing authentication services — it’s where you land after signing in. Each cluster card shows status, version, region, and its realms, so you can jump straight to what you’re working on.
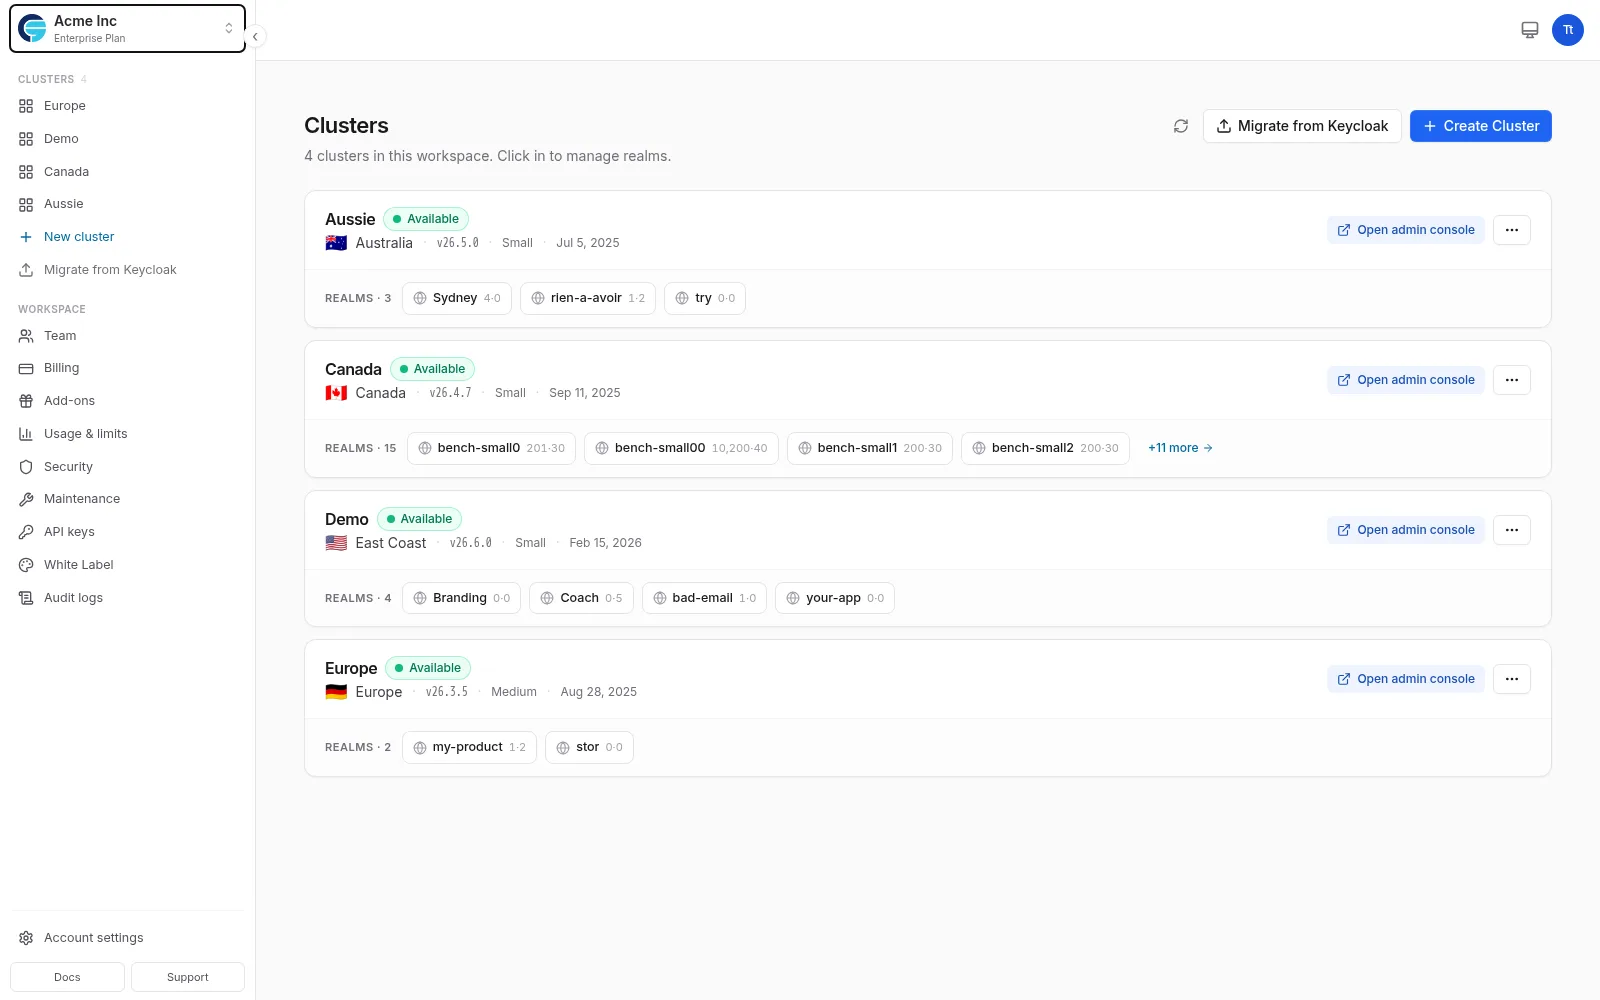
Clicking into a cluster opens its Overview — a cockpit view with live metrics, realm management, health, and recent activity.
Layout
Top Bar
The top bar provides:
- Breadcrumbs: Your current location (Clusters ▸ cluster ▸ realm ▸ page)
- Theme Toggle: Light and dark mode
- User Menu: Account settings and logout
The workspace switcher lives at the top of the sidebar — click your workspace name to switch workspaces (if you belong to several) or return home.
Sidebar Navigation
The sidebar is a context stack: what it shows depends on where you are in the Workspace ▸ Cluster ▸ Realm hierarchy.
Workspace level (the default view):
- Clusters: Your clusters, plus “New cluster” and “Migrate from Keycloak”
- Workspace: Team, Billing, Add-ons, Usage & limits, Security, Maintenance, API keys, White Label, Audit logs
- Account settings: Your personal profile, notifications, and security
Cluster level (after clicking into a cluster):
- Overview: The cluster’s cockpit view
- Observe: Insights, Events, Logs, Webhooks
- Configure: Extensions, Themes, Custom domain
- Security: Security, SIEM
Realm level (after clicking into a realm):
- Identity: Users, Groups, Roles
- Connect: Applications, Identity providers
- Customize: Branding, Email, Recipes
The stack at the top of the sidebar always shows which cluster and realm you’re working in — switch either without losing your place.
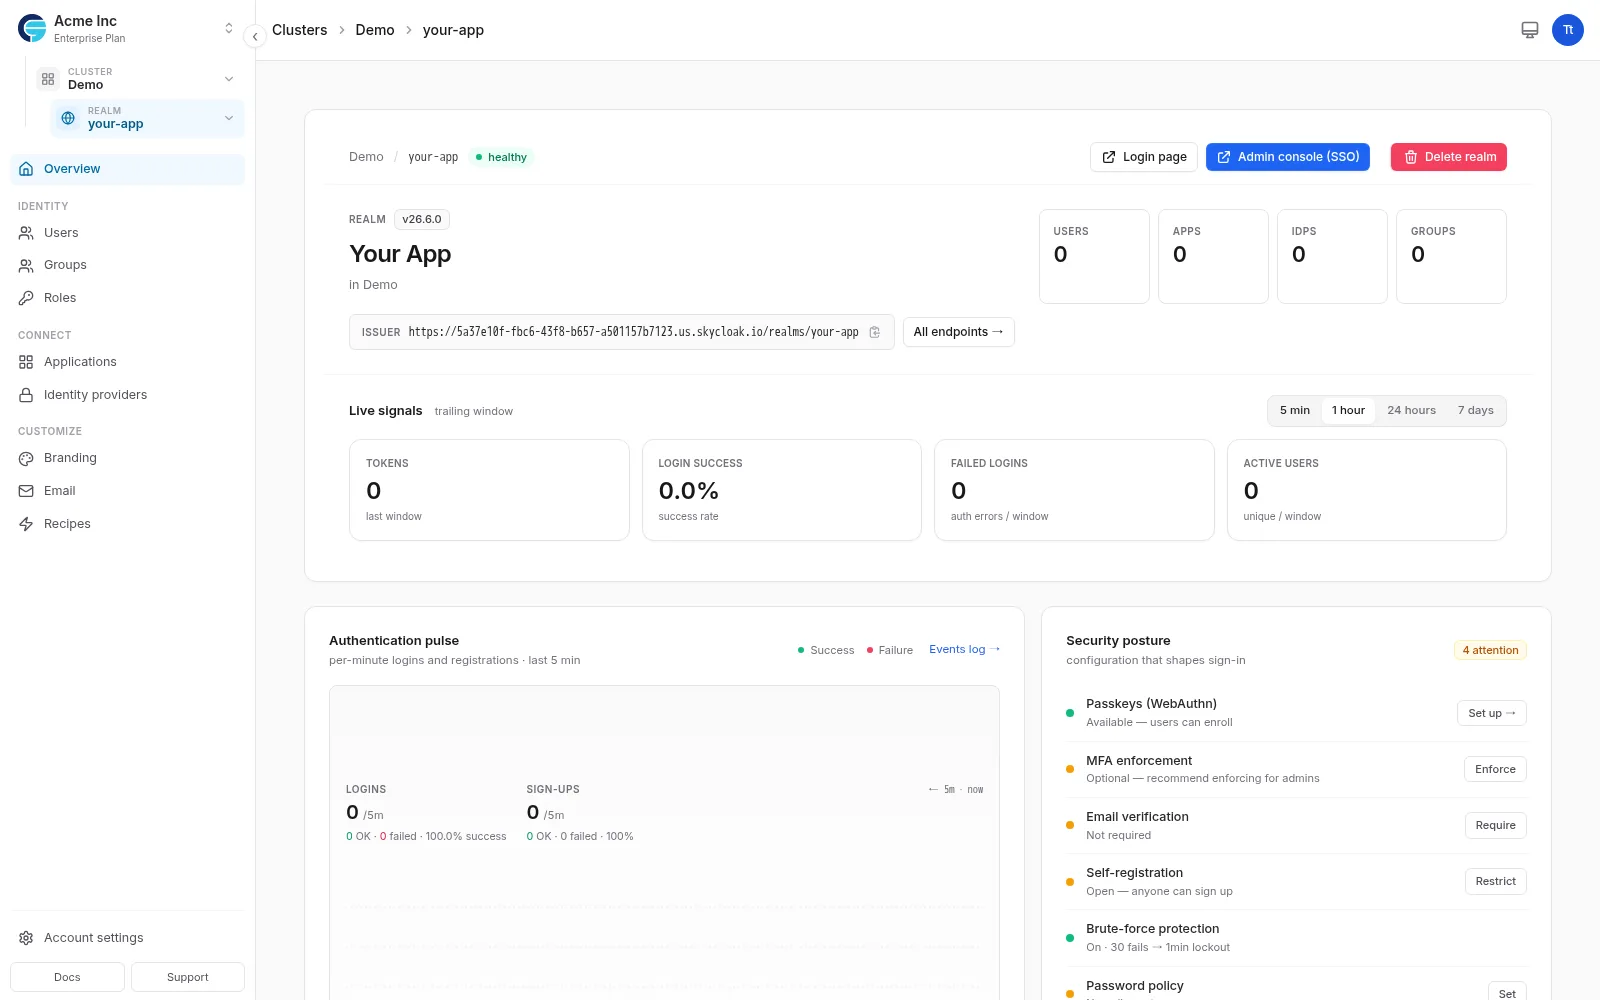
Cluster and Realm Overview
Live Metrics
Opening a cluster (or a realm inside it) shows a cockpit view with live signal tiles over a trailing window:
- Tokens: Tokens issued in the window
- Login success: Success rate with a trend sparkline
- Failed logins: Authentication errors in the window
- Active users: Unique users in the window
Health, Activity, and Maintenance
The cluster Overview also shows:
- Health: Database and version status at a glance
- Activity: Recent admin and login events, linking to the full Events log
- Maintenance: Your effective maintenance window and the next scheduled slot
Switching Clusters and Realms
Cluster and realm selection happens in the sidebar’s context stack, not on individual pages. Click a cluster in the sidebar (or the switcher at the top of the stack) to enter it; click a realm inside the cluster to scope the sidebar to that realm. The active cluster and realm determine:
- Which realm options are shown
- Application configuration context
- Branding and email settings
Understanding Status Indicators
Cluster Status
Clusters display their current operational status:
- 🟢 Available: Cluster is fully operational
- 🔵 Creating: Initial cluster provisioning in progress
- 🟡 Updating: Cluster update operation in progress (extensions, themes, scaling, etc.)
- 🟡 Degraded: Cluster is running but experiencing issues
- 🔴 Failed: Operation failed or cluster is unhealthy
- 🔴 Deleting: Cluster deletion in progress
System Notifications
Types of notifications:
- Info: General updates
- Warning: Important notices
- Error: Action required
- Success: Completed actions
Customizing Your View
Time Zone Settings
Times are shown in:
- Your browser’s time zone (default)
- UTC option available
- Configurable in account settings
Dashboard for Different Roles
Workspace Owner View
Owners see everything including:
- Billing information
- All workspace settings
- User management
- Full event logs
Admin View
Admins see:
- Cluster management
- Application configuration
- User activities
- Limited settings
Developer View
Developers see:
- Cluster access
- Application details
- Logs and debugging
- Read-only settings
Desktop Experience
The Skycloak dashboard is designed for desktop use:
- Best experienced on screens 1024px or wider
- Full feature access on desktop browsers
- Mobile devices are not recommended for dashboard management
Monitoring and Analytics
For detailed monitoring and analytics, use:
- Insights: Analytics dashboard with usage metrics
- Events: User and admin event tracking
- Logs: Real-time system logs
Troubleshooting Dashboard Issues
Dashboard Not Loading
If the dashboard won’t load:
- Check internet connection
- Clear browser cache
- Try incognito/private mode
- Disable browser extensions
Incorrect Data
If data seems wrong:
- Refresh the page
- Check time zone settings
- Verify filter settings
- Contact support if persists
Missing Features
If features are missing:
- Check your user role
- Verify workspace permissions
- Ensure plan includes feature
- Check feature availability
Dashboard Tips
Productivity Tips
- Bookmark frequent pages: Save time navigating
- Use keyboard shortcuts: Faster navigation
- Set up browser notifications: Stay informed
- Create dashboard bookmarks: Quick access
Monitoring Tips
- Review trends: Not just current values
- Correlate metrics: Understand relationships
- Document baselines: Know what’s normal
Future Enhancements
Planned dashboard improvements:
- Customizable widgets
- Advanced filtering
- Data export options
- Custom dashboards
- API access
- Third-party integrations
Next Steps
From your dashboard, explore:
- Create a cluster to get started
- Configure applications for authentication
- Set up monitoring for analytics
- Customize branding for your brand